
Sam Larner – New Regular Contributor
When I was 16 there were two things I distinctly disliked; PE lessons and maths lessons. Therefore, it is odd that for around eight years

When I was 16 there were two things I distinctly disliked; PE lessons and maths lessons. Therefore, it is odd that for around eight years
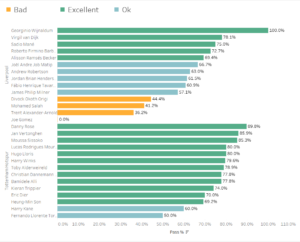
This quick video shows how you can create your own colour banding in Tableau.

This video details how to create pitch zones on top of a pitch background using Tableau. You can download my workbook on Tableau Public here…
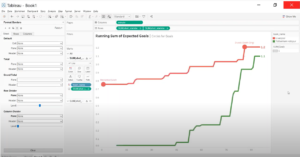
This video explorers how to create an event timeline. This case we plot expected goals across a single match.

I often get asked about how to collect XY data of your own. Here are a couple of open source tools to help you.

Surprisingly, creating a table in Tableau is not as intuitive (they want you to create visuals). Here is a simple step by step guide, and some ways to improve a table.
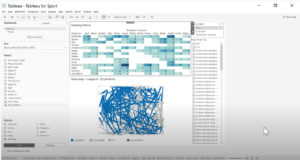
This video follows on from the previous creating a pass map. Here we build a pass matrix table and integrate the two in a dashboard.
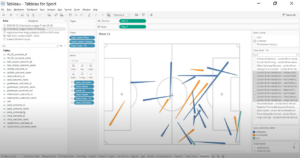
This video explores Plotting Pass and End locations on a pitch.
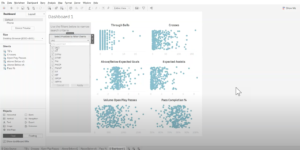
This video builds a full dashboard allowing you compares players across a number of metrics. Great for a player comparison overview.

Often you don’t just want to count numbers but also calculate %’s. IN Tableau that is achieved using a Table Calculation.
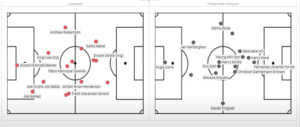
Learn how to plot the average actions of a plyer on a pitch using Tableau.
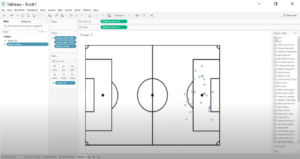
Want to plot events on a pitch in Tableau? This video explains how to create a shot map.