
Long Data v Wide Data
Something I’ve mentioned quite a lot in my Tableau for Sports series of videos is how the data is laid out and why that is
Something I’ve mentioned quite a lot in my Tableau for Sports series of videos is how the data is laid out and why that is

In 2003 a book was published which completely changed analysis. That book is Moneyball, or, Moneyball: The Art of Winning and Unfair Game to give

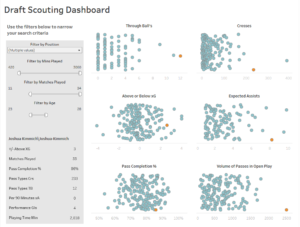
The aim here was to create this chart in one sheet rather than having to replicate it 20 times, once for each team. Data and

Metrica Sports is one of those rare examples where an idea hatched by three mates in a pub actually led somewhere great. This month I
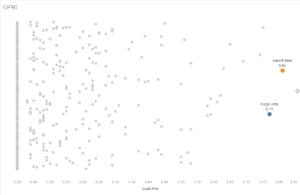
How to create a beeswarm plot in Tableau Big thanks to Ninad Barbadikar for his tutorial which you can find here. This is the calculation

Google launches three new entry-level Professional Certificates on Coursera They are designed to prepare learners for an entry-level role in under six months. The certificates
5 Questions about Tableau 1. What is Tableau? Tableau is a visual analytics platform that promises to help you see and understand data. Tableau is

The “My Best Work” series will give analysts, and those working in connected areas, an opportunity to showcase their best work. Our guest today is

You often need to merge or join additional datasets before you can analyse your data. This video shows you some simple ways to do this in Tableau.

Look at the picture below. It’s from the Tour de France in 2007. What do you see? If you are not a cycling fan you
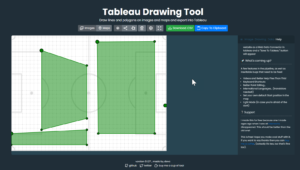
This video builds on the previous video about zones on a pitch. Here we explore this Tableau drawing tool; https://iamdavehart.github.io/tableau-drawing-tool/# Created by Dave Hart.This tool